- Miami's defense certainly stepped up to the task. They did a fantastic job limiting Dallas' ball movement and closing out on shooters. Their athleticism narrowed the passing lanes Dallas has been used to this postseason.
- Dallas came out tentative to start the game. It appeared that Dallas shooters certainly felt the pressure of not only the NBA Finals, but of the active and athletic Miami defense, missing shots they have made in the previous series as the open looks came at a premium, resulting in some rushed shots on even open looks.
- Specifically, Dirk Nowitzki and Peja Stojakovic in particular missed shots they have made throughout the playoffs. Jason Terry and J.J. Barea also missed some shots similar to those they have made throughout the playoffs. Haywood even missed a dunk.
- Miami also did a great job on the pick and roll, rendering Barea ineffective. He will certainly have to step it up going forward if the Dallas bench is to have the success they have had the rest of the postseason.
- Dirk Nowitzki was not as aggressive as he has been the rest of the postseason and as a result may not have earned some of the calls he got during the Western Conference Playoffs. More importantly, his lack of aggression resulted in fewer uncontested opportunities for his teammates through the ball movement that starts with him in the post. His lack of aggression may have hurt Dallas more than anything offensively within their control (read: not including Miami's defense).
- The biggest difference may have been the 10 more offensive boards Miami grabbed than Dallas. All four of their bench players grabbed at least one offensive board.
- Despite only shooting 38.8% from the field (35.2% inside the arc), Miami probably did a better job moving the ball than Dallas did, getting two more assists as a result despite averaging 5.6 fewer in the playoffs.
- Miami not only took more three-point field goals but they made more, shooting 45.8% (11 of 24), with LeBron James leading the way with four including a fadeaway over Tyson Chandler to end the 3rd quarter. Dwyane Wade added two himself. It is hard to expect them to keep this advantage throughout the rest of the series.
Tuesday, May 31, 2011
Observations from Game 1
2011 NBA Finals
Thanks to EvanZ from the APBRmetrics forum and The City, I might have the data I need to apply my analysis to a number of Miami Heat and Dallas Mavericks lineups soon. But, in the meantime, I wanted to provide my suspicions on which team adheres more to the theories I have provided here.
This blog is all about team chemistry and no team has played better team basketball than the Dallas Mavericks. They create an advantage, either through Dirk in the high post or the pick and roll, followed by good decisions on passes and shots, resulting in easy uncontested shots. Granted, the defenses each team has faced were not the same and the analyses on this blog have been limited to the offensive side of the ball, so take this with a grain of salt.
First, looking at the distribution of two-point field goals, where a wider distribution has proved beneficial, I anticipate that the Mavericks have the advantage. Dirk Nowitzki takes by far the largest chunk of the team's two-point field goals, with Shawn Marion and J.J. Barea chipping in with some shots around the basket, Jason Terry taking less than a handful of open mid-range jumpers and Tyson Chandler throwing in the occasional dunk or put-back. The Miami Heat, on the other hand, have Lebron James, Dwyane Wade and Chris Bosh taking a similar number of two-point field goals.
Unless the Heat can find someone to stop Nowitzki without help, the Mavericks will continue to be able to start the offense through Nowitzki in the post, force help, move the ball, and get open three-point shots by any of their very capable three-point shooters. Similarly, the Heat will also have to slow down the pick and roll to slow down the Mavericks ball movement. I look forward to seeing how much the Heat use James on Nowitzki as he may be the only one with the strength and athleticism to make things hard enough on Nowitzki to limit the need for help defense.
When it comes to three-point field goal attempts, where more attempts and a more even distribution predict an increase in offensive efficiency, it isn't even close. With great three-point shooters like Nowitzki, Jason Terry, Jason Kidd, and Peja Stojakovic, not only do the Mavericks take and make more three-point field goals, they do so at a better percentage, and I anticipate that the statistics will show that they have a more even distribution of three-point attempts among the five players in their lineups. James, Wade, Mike Miller, Mario Chalmers, Mike Bibby and James Jones all take three-point attempts, but the latter four split much of their time, and Wade, Bibby and Miller all have shot under 25% for the playoffs. Also, the Mavericks take higher quality, uncontested three-point attempts, on catch and shoot opportunities due to superior ball movement partly explaining their higher efficiency beyond the arc, where observation tells me that many of the Heat's three-point attempts are contested shots taken by James and Wade, or on broken plays or transition, which may be hard to come by against the savvy Mavericks defense.
As far as shooting from the field goes, the Mavericks have shot about 2% better from two and over 6% better from beyond the arc during these playoffs.
When it comes to getting to the line, where a more even distribution predicts greater offensive efficiency, despite Nowitzki's domination at the line during the playoffs, at first glance the Heat appear to hold the advantage when it comes to distribution, as James, Wade and Bosh all get a good number of attempts each game, taking about 24 between them during the playoffs. That said, the rest of the Heat take about 5 attempts per game. Joel Anthony earned 2.1 attempts per game, James Jones, who didn't play much against the Bulls, has earned 1.1 attempts per game in the playoffs, while nobody else on the team has averaged an attempt per game in the playoffs. Although no one on the Mavericks comes close to the attempts Nowitzki has earned in the playoffs, they have more players who get to the line each game, evening the distribution some Terry has averaged 3.7 attempts, Chandler 3.1, Brendan Haywood 2.5, Marion 2, Barea 1.8 and Jason Kidd 1.5. These are game averages, a far cry from giving us an idea of how the attempts are spread among players in the lineup. Nevertheless, there may not be a significant difference between the two teams when it comes to the distribution of free throw attempts.
With offensive rebounding, where a more even distribution predicts an increase in offensive efficiency, it is the Heat that have more players contributing in that regard, with James, Wade, Bosh, Anthony and Udonis Haslem all averaging an offensive rebound or more a game. Zydrunas Ilgauskas also rebounds well offensively, however it remains to be seen whether he will see the floor in this series, as the primary lineup he played in during the playoffs was absolutely destroyed by the opposing lineups and he failed to see the floor against the Bulls. For the Mavericks, Chandler, Marion and Haywood dominate the offensive boards, with Nowitzki and Kidd chipping in just over half an offensive board a game. It appears that the Heat have a more even distribution, giving them the advantage, but despite that, both teams have averaged the same number of offensive rebounds per game in the playoffs. So, despite the fact that the Heat have more bodies who attack the offensive glass, it appears the Mavericks offset that with the superior offensive rebounding ability of guys like Chandler, Marion and Haywood.
As far as distributing the ball goes, because it is hard to see much of a difference on first glance at the distribution of turnovers (where a number of players on each team contribute to similar team totals), it comes down to assists, where a more even distribution predicts an increase in offensive efficiency. For the Heat, James and Wade dominate the ball and in turn the assists, averaging 5.5 and 4.1 assists respectively. No one else on the team has averaged over 1.5 assists during the playoffs, with point guards Chalmers and Bibby averaging 1.5 and 1.2 assists per game, respectively. This makes for a higher standard deviation; a negative in this analysis, and the team as a whole has averaged just over 15 assists per game as a result.
For the Mavericks, although Jason Kidd has accounted for a large chunk of the team's assists during the playoffs at 7.7 per game and focuses almost entirely on facilitating the offense apart from when he is wide open for a three-point attempt, Nowitzki, Terry, Barea and Marion all average over two assists per game at 2.7, 3.2, 3.5 and 2.1, respectively. With Dallas' ball movement and likely higher percentage of shots on the catch and shoot than off then dribble, this is not a surprise. It appears the Mavericks have the advantage here as well.
So, on first glance, the Mavericks appear to have a significant advantage on the offensive end, which is reflected by their playoffs offensive rating of 113.00 and the Heat's playoffs offensive rating of 106.74 (see www.basketballvalue.com), which will require a significantly superior effort by the Heat on the defensive end to overcome, something they absolutely could be capable of. That said, with the Mavericks showing the ability to step up during stretches defensively, particularly in fourth quarters against the Lakers and Thunder, and Marion and Chandler in particular playing inspired defense, I will go out on the limb and take the older, wiser, underdogs in the series with confidence and in Game 1 tonight, where the Mavericks hold an advantage with their team play, ball movement and ability to get uncontested shots.
Friday, May 27, 2011
True Distribution Analysis with 2-Point FG replacing All FG
As suspected, replacing the field goal data with two-point field goal data found a stronger relationship between the standard deviation of the percentage of two-point field goal attempts taken by each player in the lineup and the lineup OPPP than was found between the standard deviation of the percentage of all field goal attempts taken by each player in the lineup and the lineup OPPP.

This graph illustrates that increasing the standard deviation of the percentage of two-point field goals attempted by each of the players in a lineup can increase the lineup OPPP by as much as 3 points per 100 possessions, more than found with respect to field goal attempts generally.
Interestingly, the coefficient for the standard deviation of the percentage of two-point field goals attempts with respect to the dependent variable of lineup two-point field goals made per possession was negative, while it was positive with respect to the dependent variables of lineup three-point field goals made per possession and lineup free throws made per possession. This indicates that while a greater distribution of two-point field goal attempts predicts a greater number of three-point field goals made per possession and to a lesser extent a greater number of free throws made per possession, it also predicts fewer two-point field goals made per possession.
Friday, May 20, 2011
True Distribution Analysis
To best analyze how the distribution of various roles influence offensive efficiency, we want to do so independent of the sum. This means reducing the per possession numbers of each player to a percentage of the team or lineup total, which is realistic with lineup or by position data, as opposed to the original data set comprised of players not on the floor together much of the time.
Season lineup data was used in this analysis. By position data was found to be unconducive to the analysis of the distribution of roles or statistics, for a few reasons. Most importantly, the same player can account for statistics at multiple positions throughout a game. Also, by position data combines multiple players at each position, each of which may bring a different set of skills. As a result, this makes it difficult to determine how the roles and statistics are actually distributed. For example, three-point attempts may be taken by only the guards in a starting lineup, but by only the forwards in a second unit. Although the three-point attempts are broadly distributed in each lineup, when the statistics of the two lineups are combined, the distribution looks even. This wasn't as much of a problem with the prior analysis as the standard deviations analyzed were not sum independent; sums that weighed heavily into the results. With lineup data, we are able to look at specific players, with specific skills, which is ideal for studying the distribution of roles. The true distribution analysis for offensive efficiency is below.
Field Goal Attempts

The analysis shows that a wider distribution of field goal attempts can make a difference of as much as 1.7 points per 100 possessions. This may not appear too significant, but when considered with the results regarding the distribution of three-point attempts, where an even distribution proves beneficial, we can conclude that a wider distribution of two-point field goal attempts has a greater effect than the distribution of overall field goal attempts suggests.
Three-Point Attempts

Unlike the previous results, this analysis shows that a more even distribution of three-point attempts can increase offensive efficiency by 12 points per 100 possessions. This implies that the previous results regarding three-point attempts were influenced more by the total three-point attempts than the distribution of those attempts, indicating that offensive efficiency increases as three-point attempts per possession increases, but that a more even distribution of those attempts is preferred. So, not only do we want skilled three-point shooters taking many shots, we want many of them spread around the floor.
Free Throw Attempts

The analysis shows that a more even distribution of free throw attempts can make a difference of as much as 10 points per 100 possessions. This implies that the previous results regarding free throw attempts were influenced more by the total free throw attempts than the distribution of those attempts, indicating that offensive efficiency increases as free throw attempts per possession increases, but that a more even distribution of those attempts is preferred. Lineups with multiple players capable of attacking the rim and earn free throw attempts are more efficient than those that get most of their free throw attempts from a player or two.
Offensive Rebounds

This analysis shows that a more even distribution of offensive rebounds can increase offensive efficiency by almost 3 points per 100 possessions. This indicates that lineups with multiple players capable of grabbing offensive rebounds are more efficient than those with a player or two that get most of the lineup's offensive rebounds.
Assists

Unlike the previous results, this analysis shows that a more even distribution of assists can increase offensive efficiency by 6 points per 100 possessions. This implies that the previous results regarding assists were influenced more by the total assists than the distribution of assists, indicating that offensive efficiency increases as assists per possession increases, but that a more even distribution of assists is preferred.
Turnovers
Unlike the previous results, this analysis shows that a wider distribution of turnovers can increase offensive efficiency by 15 points per 100 possessions. This implies that the previous results regarding turnovers were influenced more by the total turnovers than the distribution of turnovers, indicating that although offensive efficiency increases as turnovers per possession decreases, a wider distribution of turnovers is preferred.
Friday, May 13, 2011
NCSSORS Follow-up
After NCSSORS, I had the opportunity to further discuss my research with Dean Oliver, author of Basketball on Paper, and former Director of Quantitative Analysis for the Denver Nuggets, who kindly provided data more ideal for my analysis. Rather than using season data for the top five or eight players in minutes played to predict offensive efficiency for the team, season lineup data and game by position data was used in the follow-up analysis. This data fully accounts for the offensive efficiency being analyzed (OPPP), which appears on the Y-axis in all graphs.
SEASON LINEUP DATA
Using season data rather than game data takes into consideration all opponents faced, rather than a specific opponent, giving us individual data points less affected by defenses that may be outliers, weak or strong. Lineup data also focuses on specific players rather than the contributions of multiple players to a single position as by position data does, making it easier to pinpoint the skills of that player as opposed to those of multiple players accounting for the statistics accumulated at a particular position during a game.

Using lineup data in the analysis shows a stronger relationship between the standard deviation of three point attempts per possession and offensive points per possession than in the original analysis. Going from the lowest standard deviations in the sample to the highest made a difference of nearly 7 points per 100 possessions.
In their recent series against the Los Angeles Lakers, the Dallas Mavericks showed great success taking many threes and focusing most of the attempts on a player or two in each lineup, with Jason Terry, Jason Kidd and Peja Stojakovic (who have only played 18 possessions together through 10 games in two playoff series) taking the great majority of them. Dirk Nowitzki also took and made three point attempts, but he mostly played to his greatest strength in taking mid-range jumpers that are difficult to stop, forcing the defense to help, leading to many uncontested three point attempts for the others. Particularly in Game 4 against the Lakers, the Mavericks played the game plan of draw and kick to perfection, with the offense almost exclusively starting with Nowitzki’s mid-range or post-up game or with Kidd, Barea or even Terry penetrating off screens, forcing rotation that just could not keep up with the ball.

The relationship between the standard deviation of free throws attempted per possession and offensive points per possession was also stronger using lineup data. 17 points per 100 possessions separates the lowest standard deviations from the highest. Needless to say, having a player (or two) who can get to the line at will provides a significant advantage. It certainly hasn’t hurt the Oklahoma City Thunder this year with Kevin Durant and Russell Westbrook. James Harden also gets to the line at a high rate for the Thunder, providing another option that can attack the rim and earn free throw attempts.

The relationship between points per possession and the standard deviation of offensive rebounds is not a strong one, though lineups that have a lower standard deviation of offensive rebounds per possession still score about 1.6 points per 100 possessions more than teams with a greater standard deviation of offensive rebounds. Determining whether this is a result of more offensive rebounds being available as a result of more missed field goals requires further analysis.

The category of assists is where the most significant advantage can be found, where a higher standard deviation of assists per possession predicts in increase of as much as 20 points per 100 possessions.

Since turnovers are a negative stat, the relationship found is a negative one. Like with assists, the primary ball handler generally leads his team in this category. If that player limits his turnovers, clearly a good thing for a team’s efficiency, the standard deviation will decrease. Here you can see that from one end of the spectrum to the other, decreasing the standard deviation of turnovers per possession can make a difference of as much as 16 points per 100 possessions.
GAME BY POSITION DATA
Game by position data accounts for what a team gets out of each position for the duration of each game. It takes into consideration the contribution of every player that played in that game rather than a specific group of five as is the case with lineup data. The following graphs represent how the stated standard deviation variables influence offensive points per possession. These results reflect those from the lineup analysis, with the exception of offensive rebounds, where the relationship reversed. In addition, the standard deviation of field goal attempts per possession proved significant in this analysis as well, although just slightly, with a more even distribution of field goal attempts per possession predicting an increase of up to 0.8 points per possession.

This graph illustrates that when observing game by position data, increasing the standard deviation of three point attempts per possession predicts an increase of as much as 17 points per 100 possessions.

This graph illustrates that when observing game by position data, increasing the standard deviation of free throw attempts per possession predicts an increase of as much as 13 points per 100 possessions.

Unlike the previous results, this graph illustrates that when observing game by position data, increasing the standard deviation of offensive rebounds per possession predicts an increase of as much as 1.2 points per 100 possessions. This does not represent the strongest relationship, similar to the negative relationship found in the original and lineup, so the change is not a great one, and in either case, the distribution of offensive rebounds does not have a strong relationship with offensive efficiency.

This graph illustrates that when observing game by position data, increasing the standard deviation of assists per possession predicts an increase of as much as 20 points per 100 possessions.

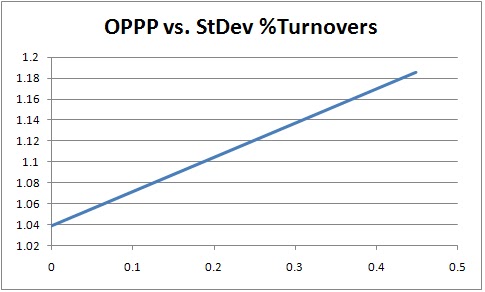
This graph illustrates that when observing game by position data, decreasing the standard deviation of turnovers per possession predicts an increase of as much as 8 points per 100 possessions.
NEXT
The standard deviation of per possession numbers used in the above analyses are affected not only by the distribution of those categories, but also by the aggregate team per possession numbers in those categories. For example, if Team A averages twice as many assists per possession as Team B, but those assists are similarly distributed between the five players on the floor, with 60% going to one player, and 10% each going to the other four players, the standard deviation variable for Team A will be twice that of Team B, and Team A will score more points per possession, all else being equal, as reflected above. The same goes true for free throws attempted. This applies to turnovers as well, though with the opposite effect.
Given this, in addition to looking at the distribution of various statistical categories, this analysis lends insight into the influence of the aggregate as well, which is more obvious with respect to certain per possession statistical categories like free throws attempted, assists and turnovers than it is with field goals attempted, three-point field goals attempted and offensive rebounds. When the relationships found above are consistent with the assumed relationship between the per possession total in a particular category and offensive points per possession, the affect of the distribution of those statistical categories remains unclear. To exclusively analyze the distribution of roles or categories independent of the total, the total must be removed from the analysis. Reducing each player's per possession totals into a percentage of the team per possession total and using the standard deviation of those percentages in the analysis instead of per possession values, will better predict the influence of distribution alone. This analysis and the implication of those results with respect to the above results will soon follow.
Given this, in addition to looking at the distribution of various statistical categories, this analysis lends insight into the influence of the aggregate as well, which is more obvious with respect to certain per possession statistical categories like free throws attempted, assists and turnovers than it is with field goals attempted, three-point field goals attempted and offensive rebounds. When the relationships found above are consistent with the assumed relationship between the per possession total in a particular category and offensive points per possession, the affect of the distribution of those statistical categories remains unclear. To exclusively analyze the distribution of roles or categories independent of the total, the total must be removed from the analysis. Reducing each player's per possession totals into a percentage of the team per possession total and using the standard deviation of those percentages in the analysis instead of per possession values, will better predict the influence of distribution alone. This analysis and the implication of those results with respect to the above results will soon follow.
Initial Analysis
My efforts to define chemistry in basketball began with research for my Masters in Sport Management at the University of San Francisco, which I presented via poster at the 2010 Northern California Symposium on Statistics and Operations Research in Sports (NCSSORS), held by Dr. Ben Alamar, the Director of Basketball Analytics and Research for the Oklahoma City Thunder, and Peter Keating later wrote about in his blog for ESPN.

NBA regular season team and player data since 1997 was gathered from Basketball-Reference.com and used to create the data sets for this study. 370 teams were observed. The 1997-1998 season was chosen as the initial season in the data set as it was when the three-point line was moved back to 23’9”, where it has since remained. Team and player stats were adjusted for team pace and minutes played.
The charts on the right side of the poster display the following results: A wider distribution of three-point attempts predicts an increase of as much as 4 points per 100 possessions. A wider distribution of free throw attempted predicts an increase of as much as 3 points per 100 possessions. A wider distribution of assists predicts an increase of as much as 2 points per 100 possessions. A more even distribution of turnovers predicts an increase of as much as 2 points per 100 possessions. A more even distribution of offensive rebounds predicts an increase of as much as 4 points per 100 possessions. The distribution of field goal attempts was not significant in this analysis.
There are some significant differences in points scored between the widest and most even distribution of various statistical categories. With the exception of offensive rebounds and turnovers, a wider distribution proved more beneficial, indicating that teams built with more defined roles in shooting and distributing are more efficient. This is just the beginning of this analysis and the implication of the results of analyzing how roles are distributed deserves more thought, as Kevin Pelton suggested in his recap of the NCSSORS conference.
Subscribe to:
Posts (Atom)